
Hands-on exercises for learning Imaris
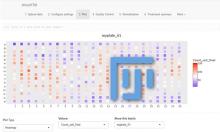
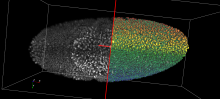
Imaris, Visualization, spots segmentation, surfaces segmentation, colocalization, spots tracking, Batch, plotting graphs with Vantage.
Visualisation vs Plotting vs Image generation. Should these be merged? Which of these should be the top concept, and which sub-concepts, and which narrow synonyms?
Imaris, Visualization, spots segmentation, surfaces segmentation, colocalization, spots tracking, Batch, plotting graphs with Vantage.