CellProfiler Pipeline

Description

The workflow computes cell-based colocalisation of two stainings in 2-D images. Both pixel- and object-based readouts are provided and some pros and cons are discussed. Please read here for more information:

https://github.com/tischi/ImageAnalysisWorkflows/blob/master/CellProfil…


Input data type: 

images

Output data type: 

processed images, numbers, text file, csv files

Description

In this example, cells are grown as a tissue monolayer. Rather than identifying individual cells, this pipeline quantifies the area occupied by the tissue sample.


Download package also contains example images. 

Description

quote

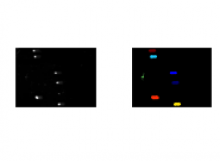
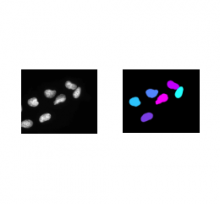
This is a simple example of a DNA damage assay using single cell gel electrophoresis. Here, the measurement of interest is the length and intensity of the comet tail. Also, illumination correction is used to reduce background fluorescence prior to measurement. Also shown is a silver-stained comet example in which the percentage of DNA contained in the tail is calculated.

Example Images: Packaged together with the cellprofiler pipeline file. 

Description

Quote:

This pipeline shows how to identify smaller objects (foci) within larger objects (nuclei) and how to use the Relate module to establish a relationship between the two as well as perform per-object aggregate measurements (such as number of foci per nucleus). Sample images are included in the download package.