Mac

Description

Colocalization Colormap –an ImageJ Plugin for the Quantification and Visualization of Colocalized Signals

This ImageJ plugin implements the Jaskolski's algorithm (Jaskolski et al. 2005). It creates a pseudo-color map of correlations between pairs of corresponding pixels in two original input images. With it one can quantitativly visualize colocalization.

Icon of the Colocalization Colormap Olugin
Description

This plugin is able to stitch an arbitrary collection or grid of images, it does not matter if it is 2d, 3d, 4d or 5d images as long as all images are of the same type. In contrast to the Pairwise Stitching of two images, this plugins will load (and potentially save) the images from/to harddisc.

grid stiching Fiji
Description

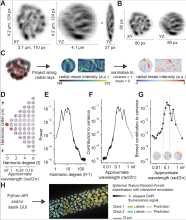
This toolkit extracts Spherical Textures: Angular projections of 2D or 3D image objects with subsequent spherical harmonics analysis.

From the author summary: "We introduce a novel method to extract quantitative data from microscopy images by precisely measuring the distribution of intensities within objects in both 3D and 2D. This method is easily accessible through the object classification workflow of ilastik, provided the original image is segmented into separate objects. The method is specifically designed to analyze the convex region in objects, focusing on the variation in fluorescence intensity caused by differences in their shapes or patterns."

Fig. 2 from reference publication
Description

Quote:

The Pairwise Stitching first queries for two input images that you intend to stitch. They can contain rectangular ROIs which limit the search to those areas, however, the full images will be stitched together. Once you selected the input images it will show the actual dialog for the Pairwise Stitching.

has function
need a thumbnail
Description

3DeeCellTracker is a deep-learning based pipeline for tracking cells in 3D time-lapse images of deforming/moving organs.

The installation comprises a set of Jupyter notebooks and a library they depend on. The workflow steps include separate training and segmentation/tracking.

Examples of cell tracking from the reference publication are: ~100 cells in a freely moving nematode brain, ~100 cells in a beating zebrafish heart, and ~1000 cells in a 3D tumor spheroid.

Overall procedures of our method (Wen et al. eLife, 2021–Figure 1)